
How Health Clinics Can Use AI to Interpret Wearable Data
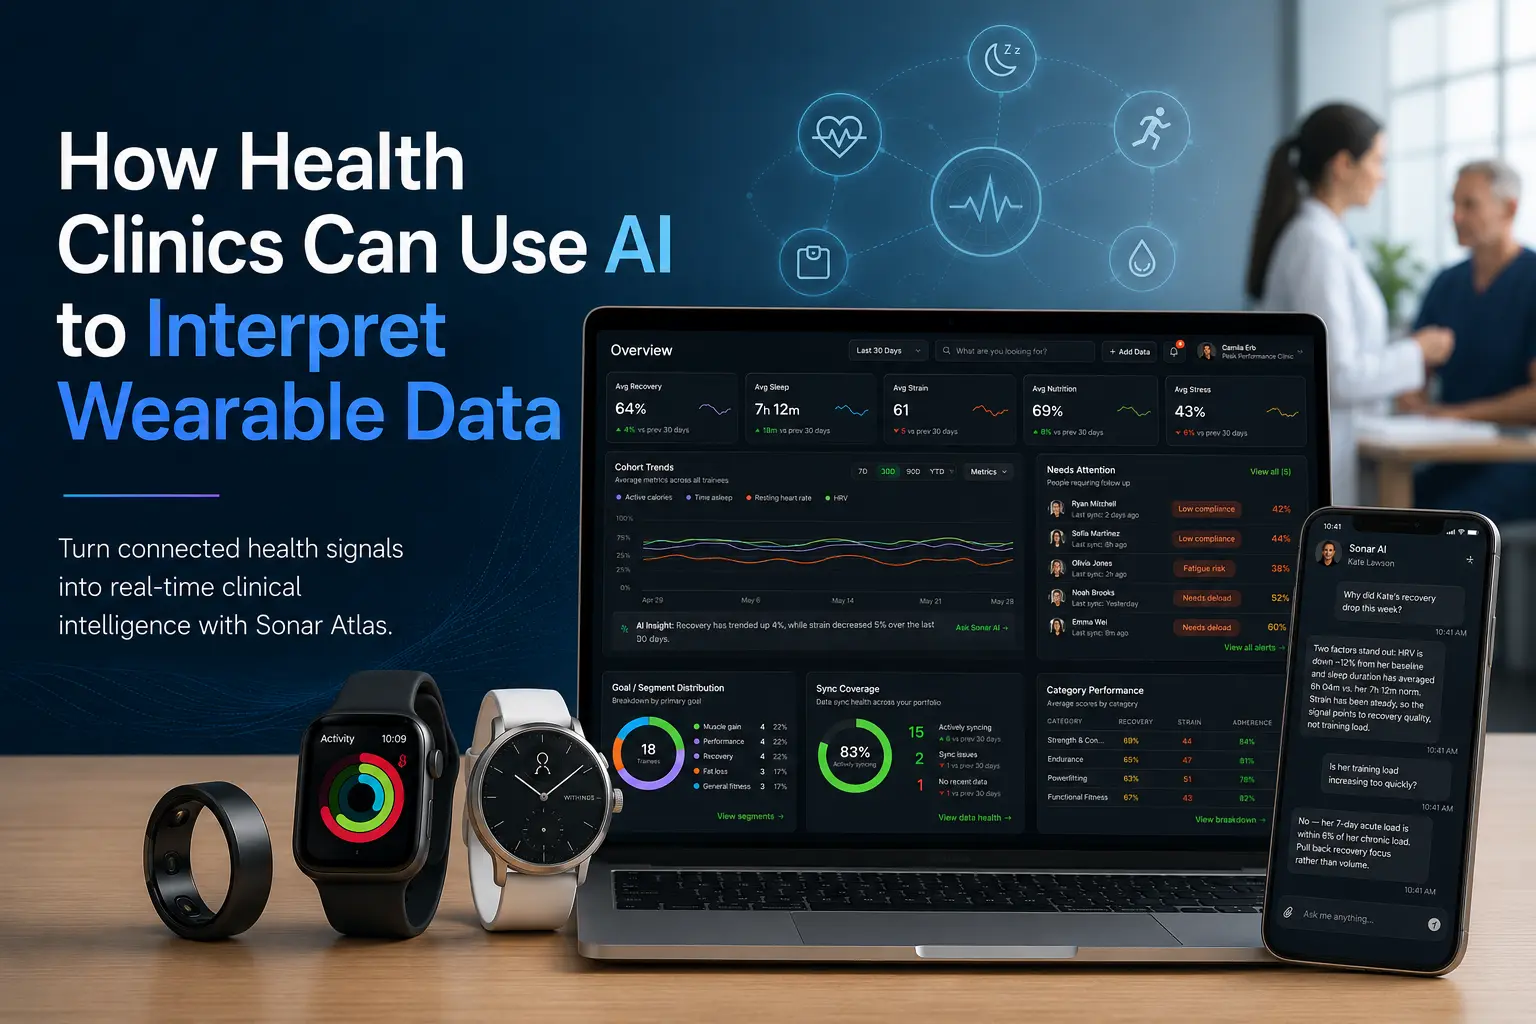
Your clients are already walking in with more data than a single visit can cover. Sonar Atlas brings it together and uses AI to help your team turn that wearable data into real-time clinical intelligence.
If you run a longevity clinic, a functional medicine practice or work in private general practice, you already know the shift that's happened over the past few years. People show up having tracked their sleep for six months, logged every meal in an app and worn a continuous glucose monitor longer than they've seen anyone on your staff. That data is highly valuable if you can query it. Otherwise, it can become a burden if it just sits in a screenshot on a client's phone or is fragmented across multiple sources.
Sonar Atlas pulls scattered wearable and app data from your entire client base into one platform built for population health and clinical data intelligence. Your team can review trends across everyone in your care, drill down into a single client's profile or ask Sonar AI a natural language question to get an answer built from real numbers.
One dashboard instead of a dozen logins
Remote patient monitoring only works if someone can actually see the data without logging into five separate accounts. A client wearing an Oura ring to bed, tracking workouts with an Apple Watch and tracking meals through MyFitnessPal has three disconnected data streams. Stitching these together is a manual process that eats up time your team doesn't have.
Atlas connects more than 600 wearables, apps and devices, covering Apple Health, Google Health, Garmin, Oura, Withings and Strava among others. Sleep, activity, recovery, nutrition, body composition and health records all flow into one profile per client rather than staying siloed by wearable.
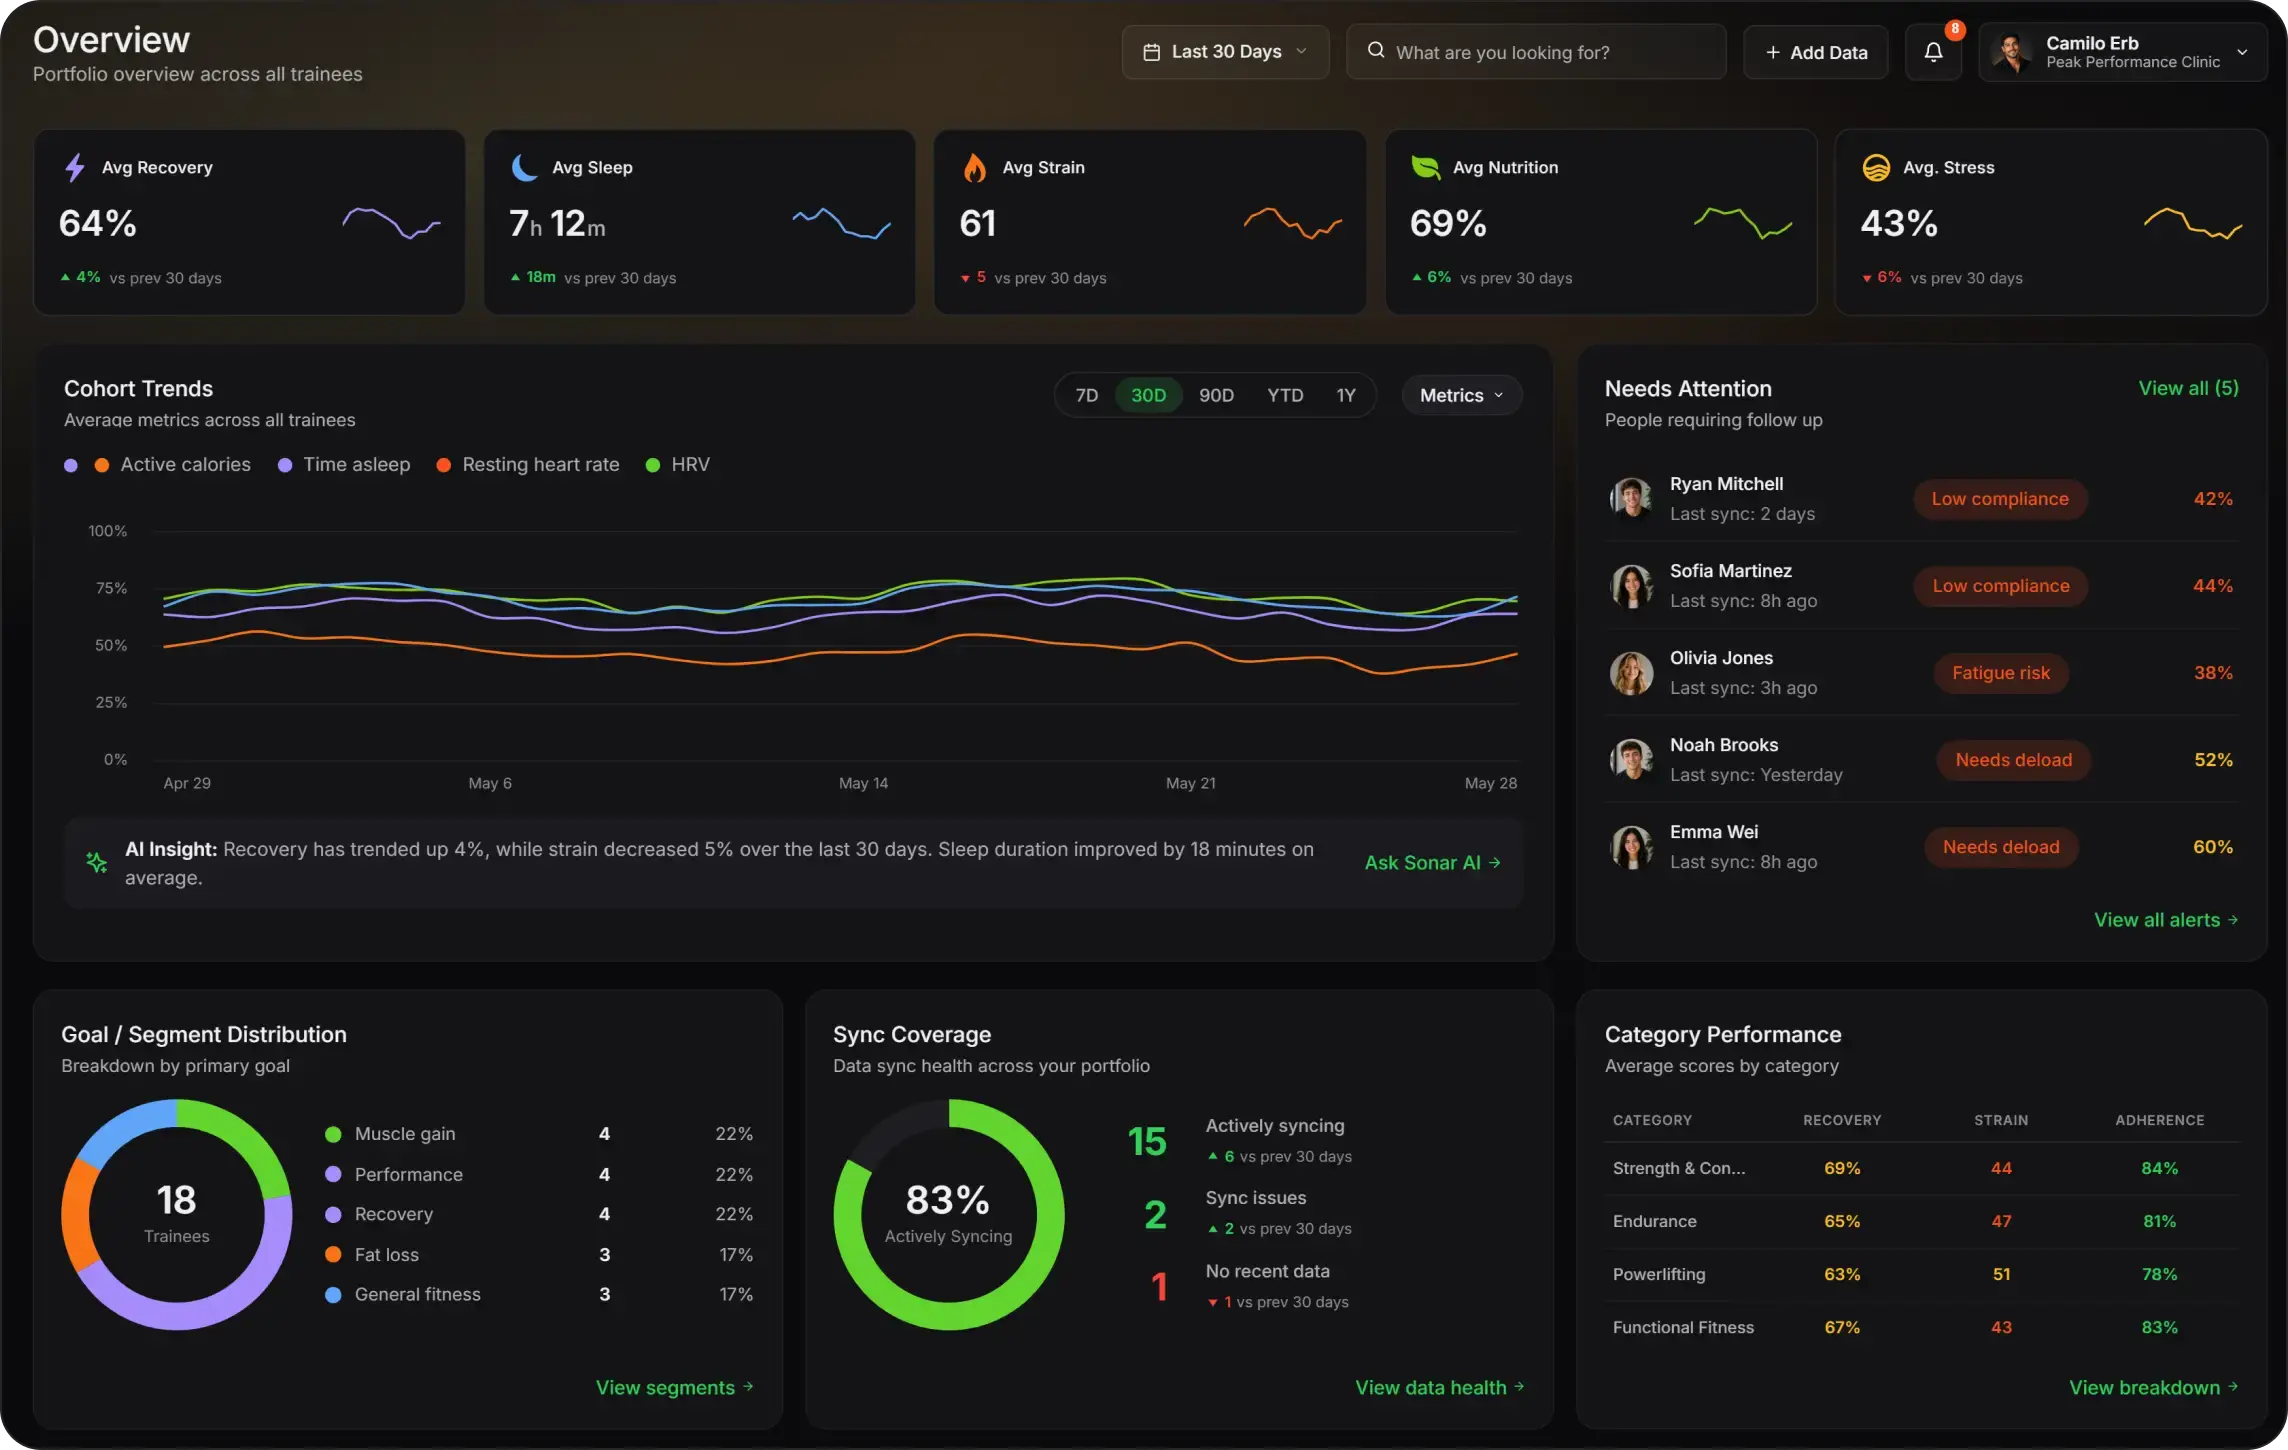
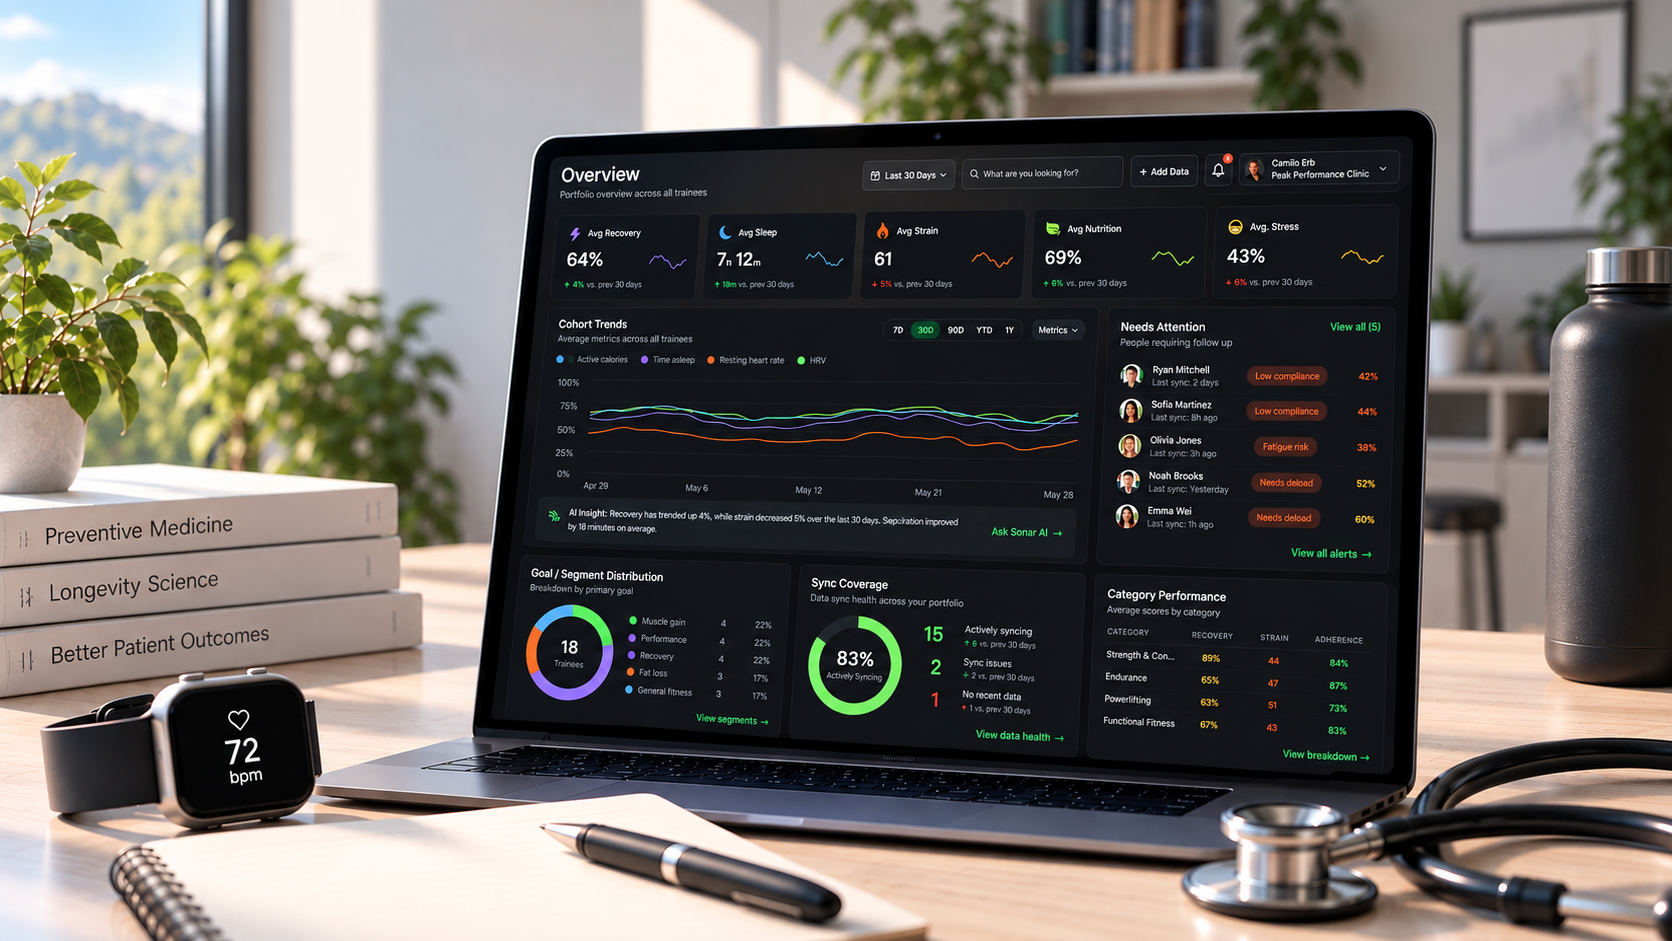
From the Overview dashboard, your team can see the whole client base in one place. You can review average recovery, sleep, strain, stress and nutrition scores for any selected period. You can also see how those scores are changing over time, which devices are syncing and which clients may need follow-up. What once required several apps and a manually built spreadsheet now lives on a single screen.
Visibility into clients who need the most attention
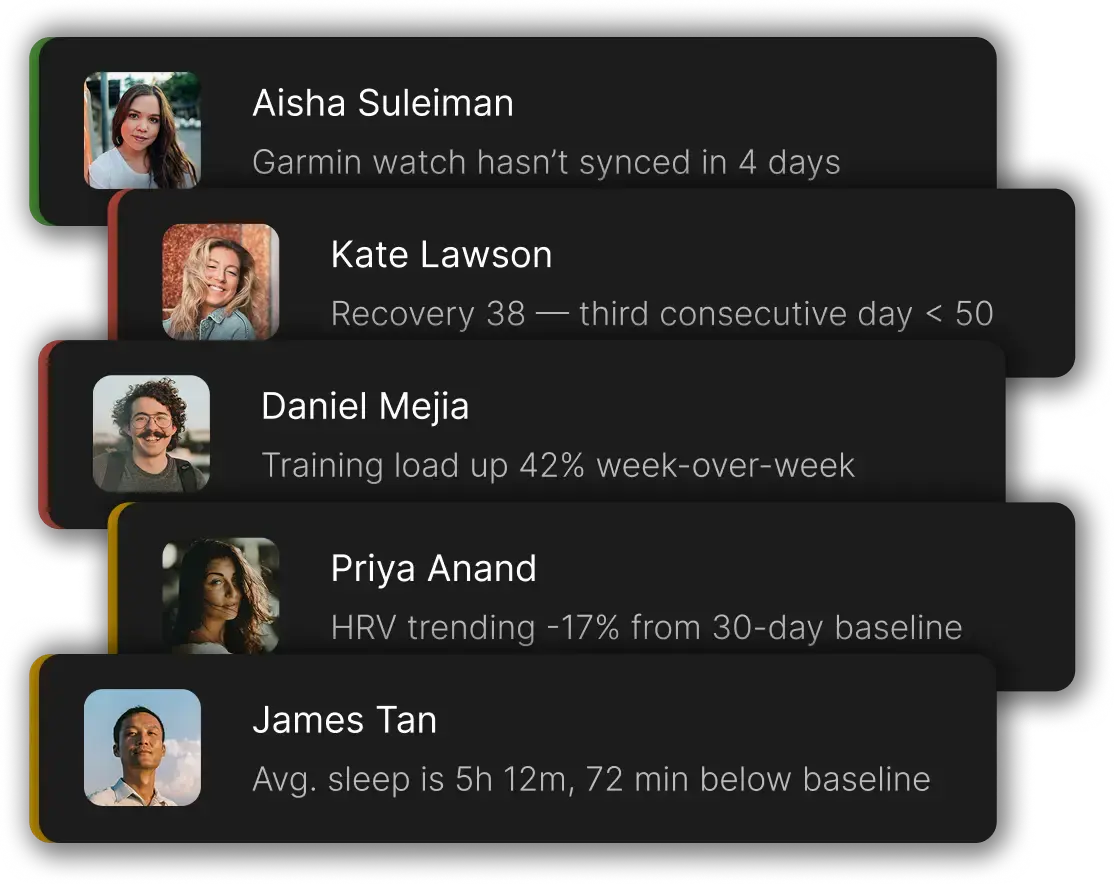
Every clinic has some version of the same daily bottleneck: too many client profiles, not enough time to open each one. Instead of scanning the roster manually, clinicians can ask Sonar AI to surface exceptions directly.
"Which clients have shown declining HRV for five straight days even though their sleep duration looks normal?"
"Flag anyone whose resting heart rate is trending up while their logged activity has stayed flat or dropped."
"Who are the 5 clients that need immediate attention and why?"
"Surface clients whose sleep efficiency has stayed under 80% for two weeks running."
The alert points to the specific reading that triggered it and shows how that value compares with the person's own history. From there, staff can open the full profile to verify the source data before making any recommendation.
Get an explanation, not just a data point
Spotting a change is one thing. Understanding what's driving it is a different task entirely and it's usually the part that consumes the most time. Sonar AI is built to answer that second question directly by pulling together everything relevant to a single client instead of making someone flip between charts.
"What's behind Kate's drop in recovery this week?"
"Line that up against her nutrition logs and hydration over the same stretch and tell me what changed."
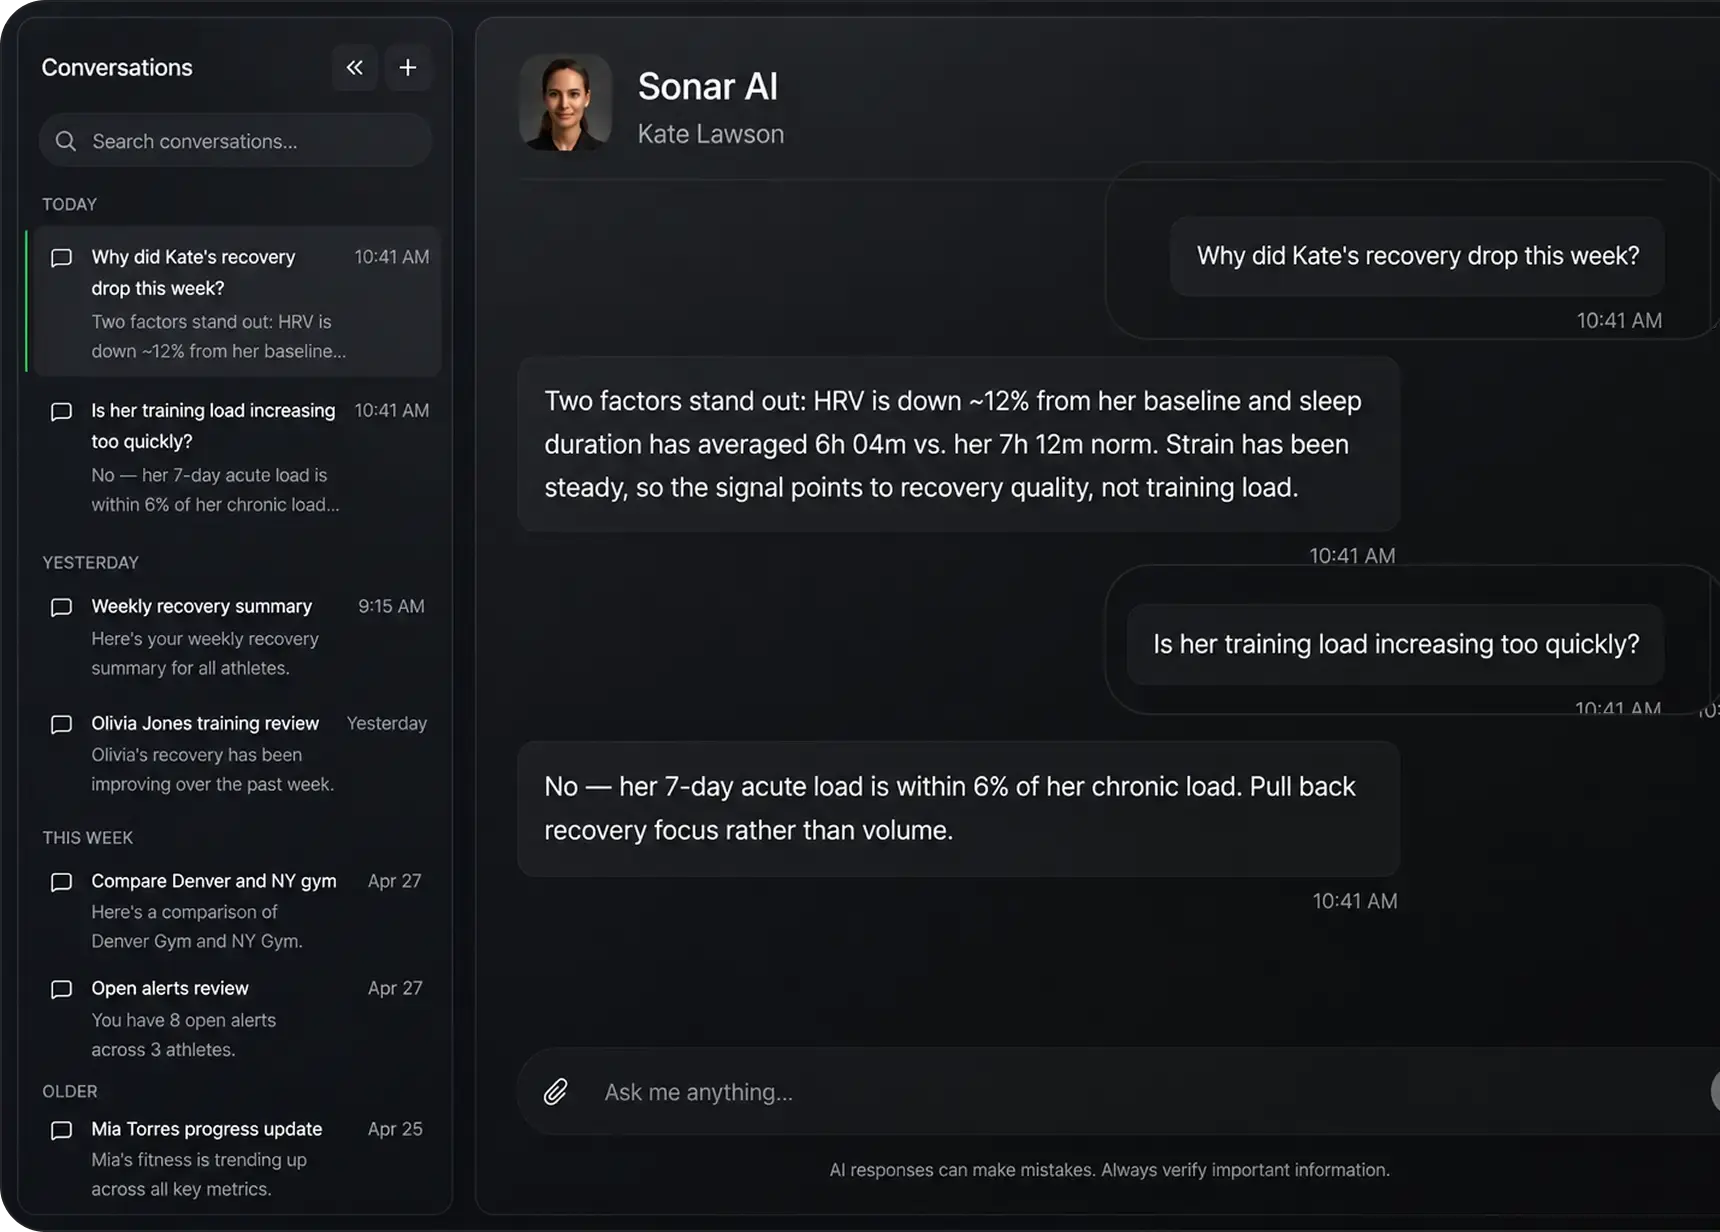
The first question gives staff a clear explanation based on Kate's own data. Sonar AI might show that her HRV is about 12% below baseline while her sleep has fallen from a typical 7 hours 12 minutes to 6 hours 4 minutes. If her activity has stayed relatively stable, the pattern points more towards changes in sleep and recovery quality than a spike in training load.
The follow-up question adds another layer of context. Sonar AI can review her nutrition and hydration data over the same period to see whether anything else changed alongside the drop in recovery. If calorie intake also fell on the nights her sleep worsened, staff have a more specific pattern to investigate than a low recovery score on its own.
Because Sonar AI keeps the context of the conversation, staff can keep narrowing the analysis without starting over. They can ask to see Kate's sleep trend, compare the same metrics with last month or explore another related signal using the same thread.
Ask for trends in the format your team actually needs
Different roles need different levels of detail. A practitioner preparing for an appointment may want exact daily values. A coordinator doing a quick check-in may only need a short summary. Someone reviewing long-term progress may prefer to see the trend depicted in a chart.
"Overlay her HRV and sleep duration on the same chart for the last 60 days so I can see if they move together."
"Break her step count and active calories down by day for the past three weeks, not just the weekly total."
"Write a two-sentence recovery summary I can drop straight into her appointment notes."
Sonar AI can shape the response around the question. It might return a chart that compares multiple metrics, a day-by-day table with exact values or a short written summary that staff can use elsewhere.
Charts can also show the client's typical range for each metric. That makes it easier to see whether a change is meaningful for that individual instead of comparing them with a generic target.
Spot patterns across your whole client base at once
Looking at one client at a time only tells part of the story. Sonar Atlas can also support population health analysis by helping teams compare patterns across a broader group and identify where similar trends are showing up.
"Which clients are hitting their step targets every week but still showing elevated resting heart rate?"
"Find everyone in the metabolic health program whose weight trend and activity level have both plateaued this month."
"Rank clients by how consistent their sleep schedule has been over the last quarter, not just total hours."
These questions are most useful when they include a clear metric and time frame. Adding another condition can narrow the group even further. Instead of asking something broad like "who's struggling," staff can combine a few relevant signals to find a more specific population health pattern.
Teams can also filter the Overview by program or cohort first. Once someone stands out, they can dive deeper into that individual profile for a closer look.
Bringing multiple devices and apps together without losing accuracy
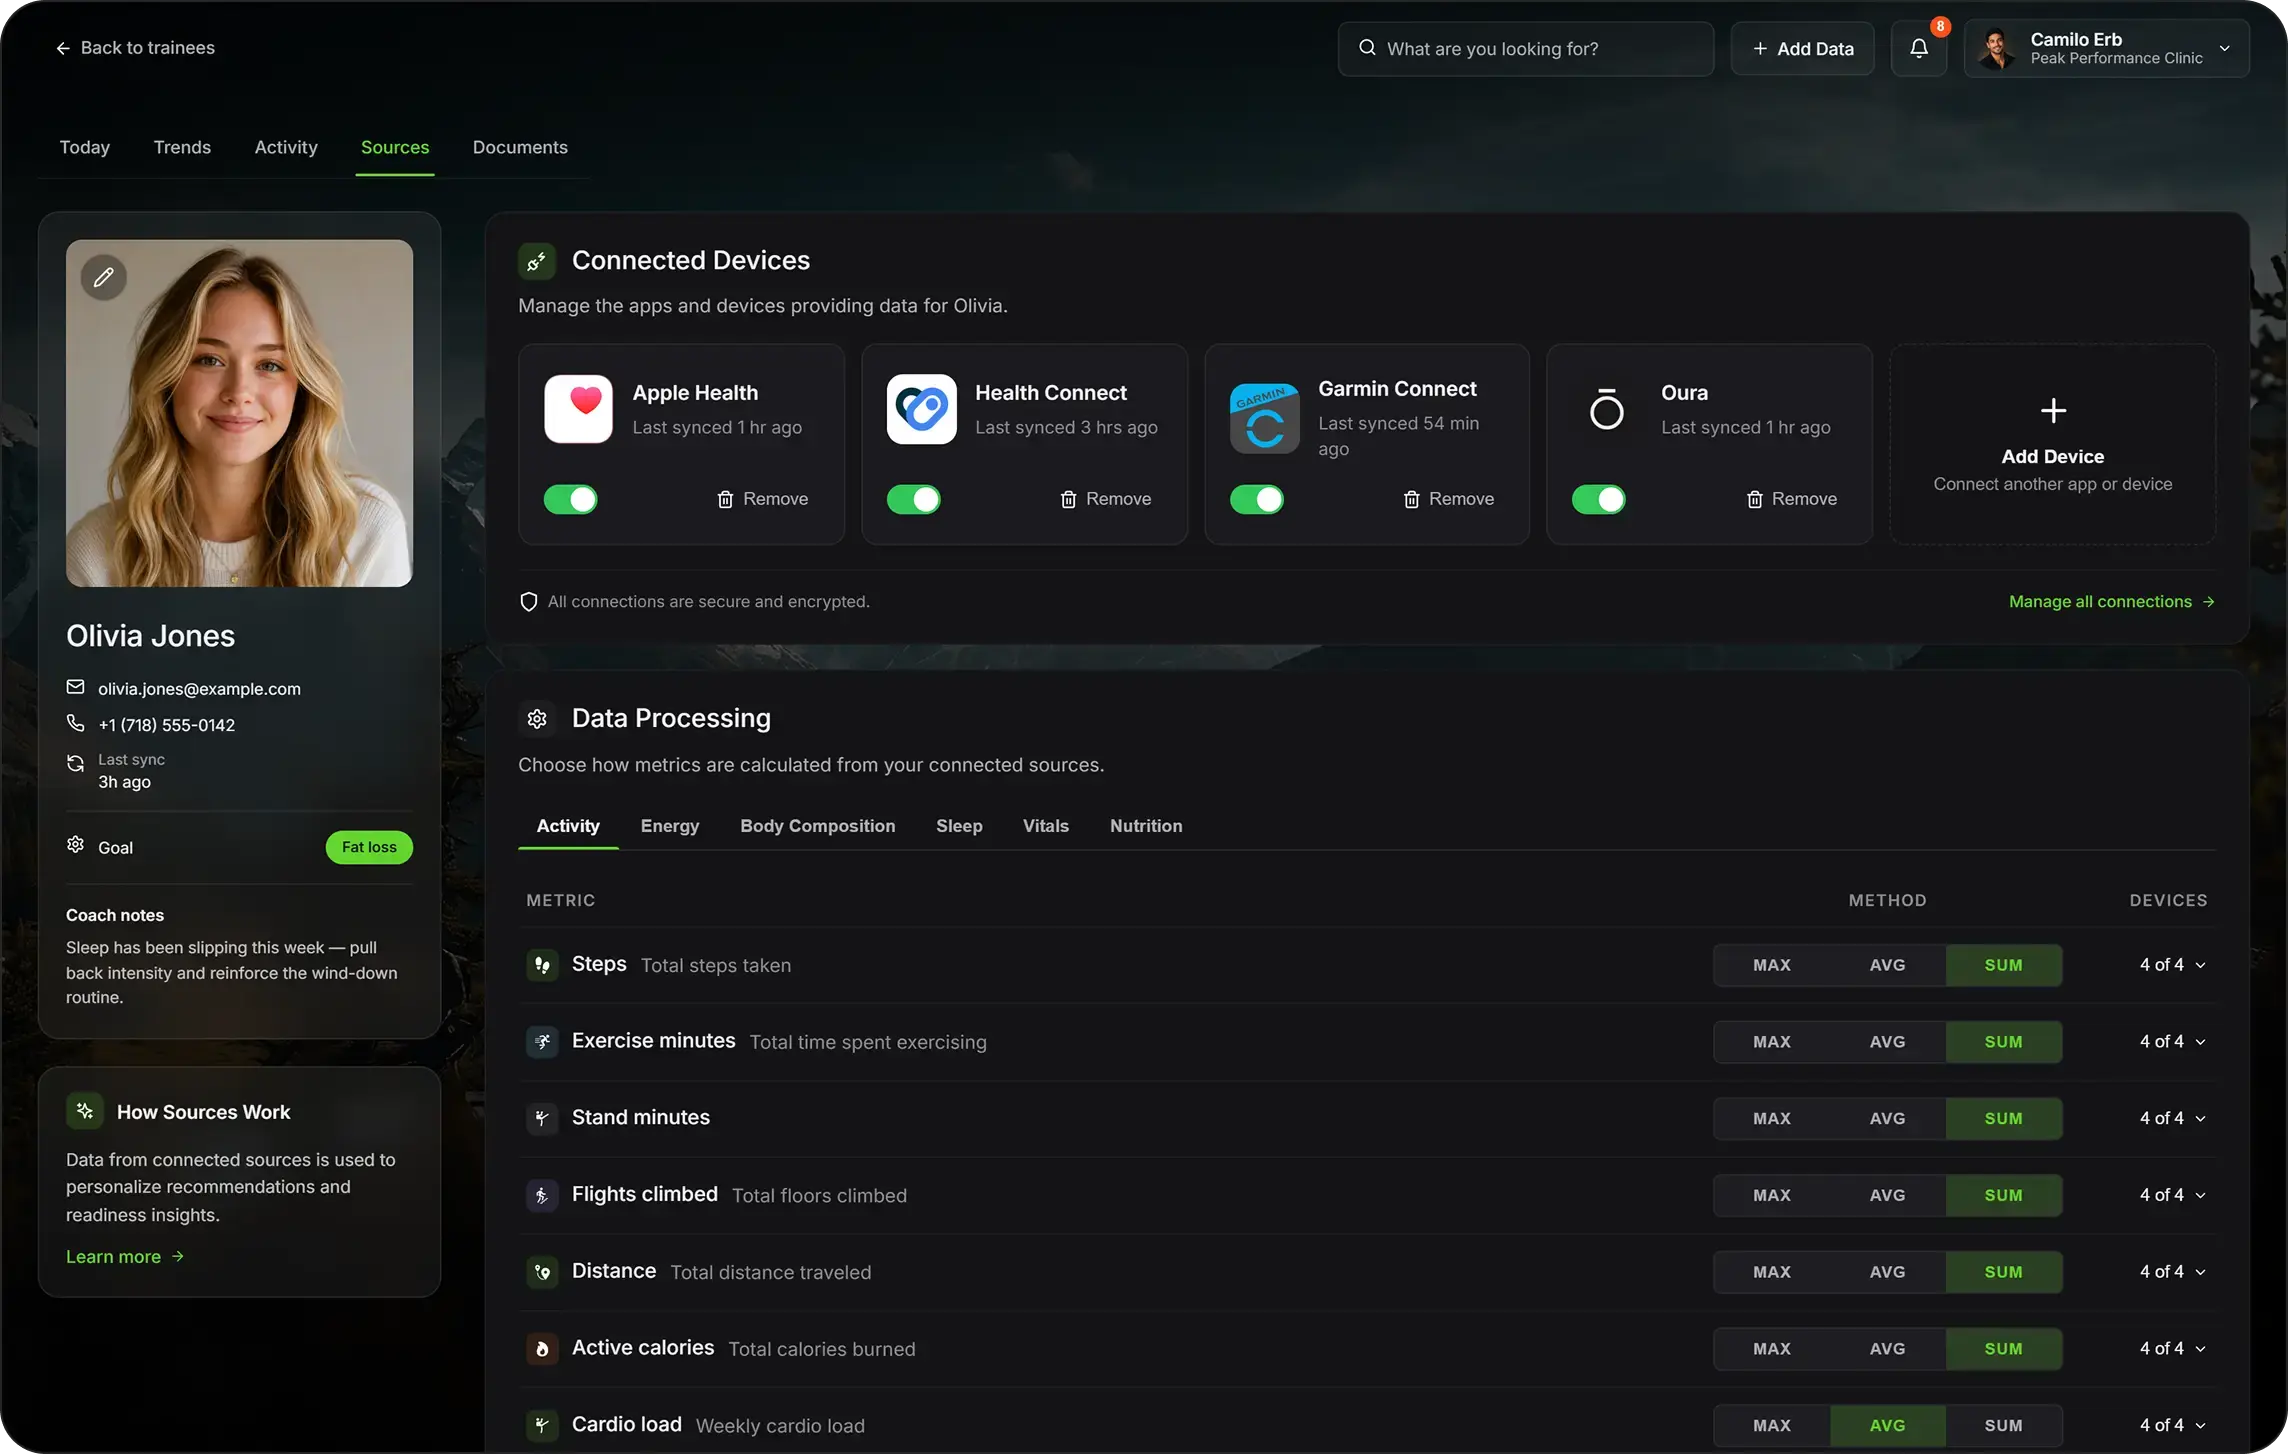
Most clients use more than one device or app. Someone might use an Apple Watch for activity, an Oura ring for sleep and a separate app entirely for nutrition. The Sources tab on each client's profile lists every connected device, the last time it synced and whether it's still actively contributing data.
When two devices report the same metric, Atlas doesn't just pick one arbitrarily. Your team can set a merge rule per metric, choosing between Max, Average or Sum. For cumulative metrics like steps or sleep stages, Atlas defaults to Max. That helps favour the source with the most complete reading for the day instead of adding overlapping data together. For point-in-time metrics such as HRV or resting heart rate the default is Average. The Sources panel also shows how many devices are contributing to each value. If a number looks unusual, staff can trace it back to the connected sources and check for sync gaps before deciding how much weight to give it.
That reconciled data becomes the foundation for Sonar AI. Instead of analysing separate exports and trying to determine which source to trust, it works from the unified values Atlas has already resolved. That gives teams a cleaner base for clinical data intelligence and makes the AI more useful than a dashboard that simply displays disconnected metrics.
Use Sonar AI Across Your Existing Clinic Workflow
The value shows up once it becomes part of a routine your staff already follows, rather than a separate tool someone has to remember to check.
Start of day check
In the morning, ask who needs attention, review top alerts and check for any sync issues across your client base.
Before each appointment
Pull a quick snapshot for whoever's on the schedule next: recent sleep, recovery and activity. Catch anything worth raising before the conversation starts instead of during it.
Monthly check-ins
Ask for a 30 or 90 day summary of activity, sleep and recovery, compare it to the period before, and flag anyone whose trend has drifted outside their usual range.
Cohort level review
Filter the Overview by program or goal, look at how the group is trending as a whole, then use Sonar AI to pinpoint which individuals are pulling that trend in one direction or another.
Want to see it in action?
Explore Sonar Atlas and book a demo to see how it can support better outcomes for your clinic.
About Sonar
Your body is talking. Are you listening? Sonar unifies all of your wearables, lifestyle, and biomarker data to unlock personalised insights and detection once reserved for elite athletes and biohackers. Trusted by 250,000+ users across 170+ countries, Sonar helps you cut through the noise across sleep, recovery, stress, activity, and nutrition - so you can focus on what actually matters. Sonar isn't just another health tracker. Launched out of Columbia University in New York, it merges the latest medical, sports and data science with AI engines that continuously surface subtle shifts and patterns across millions of data points, helping you know when to push, when to pause, and where to focus next.
More to Explore
18 September 2026
31 August 2026
Get the latest from Sonar
Share your email to stay up-to-date with all things Sonar
- English (Australia)
- Bahasa Indonesia
- Bahasa Melayu
- Català
- Čeština
- Dansk
- Deutsch
- English
- English (Canada)
- English (UK)
- Español (España)
- Español (Latinoamérica)
- Español (México)
- Français
- Français (Canada)
- Hrvatski
- Italiano
- Magyar
- Nederlands
- Norsk
- Polski
- Português (Brasil)
- Português (Portugal)
- Română
- Slovenčina
- Slovenščina
- Suomi
- Svenska
- Tiếng Việt
- Türkçe
- Ελληνικά
- Русский
- Українська
- עברית
- العربية
- हिन्दी
- ไทย
- 한국어
- 日本語
- 简体中文
- 繁體中文
EN